🏀 Machine Learning Madness: Predicting Every Tournament Matchup
Mar 15, 2018 • 6 min • Data Science
It’s that time of the year again. March Madness is here, that means it’s time to fill out your brackets and promptly be disappointed when it’s inevitably busted for all your friends and family to see.
It’s not all bad news though. The NCAA Division I Men’s Basketball Tournament is one of the most exciting sporting events of the year thanks to the upsets, Cinderellas, and unpredictability that come with it. Millions of basketball fans and non-basketball fans alike grab their virtual sharpies every March to participate in this phenomenon with hopes of achieving an improbable perfect bracket. Just how improbable? Given you know a little about basketball, professors put your odds conservatively at 1 in 128 billion.
Motivation
Thanks to my upbringing and an excess of Sportscenter growing up, I’ve been an avid college basketball fan for as long as I can remember. Each year I look forward to conducting research and methodically filling out a bracket.
However, this year I decided to try my hand at modeling the tournament for the first time after receiving an email regarding an upcoming Kaggle competition titled: Google Cloud & NCAA® Machine Learning Competition. If you aren’t familiar with Kaggle, it’s branded as the ‘Home for Data Science & Machine Learning’. Kaggle hosts machine learning competitions, collects interesting datasets, and features guides to help you grow as a data scientist.
Competition
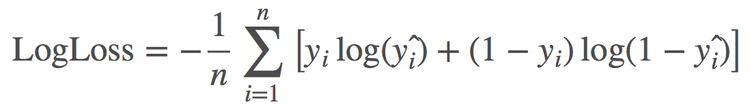
The goal of the contest is to utilize past tournament results to build and test models in order to forecast outcomes of all possible match-ups in the 2018 NCAA Division I Men’s Basketball Championship. These outcomes are to be computed probabilistically, for example, Team A has a 55% chance to beat Team B. Each final submission is then evaluated and ranked on the public leaderboard using a metric known as log loss. If you aren’t familiar with log loss, just know that smaller is better. The use of the logarithm provides extreme punishments for being both confident and wrong as seen in the formula below:
Approach
Coming into this project, I had a general idea of what I wanted to do with it. With this being said, I did some research on similar projects from previous years where I discovered a couple insights that proved useful to me.
First, it seemed like a lot of models went with logistic regression as their primary algorithm due to probabilistic nature and effective, yet simple implementation. Second, many models utilized other highly acclaimed rankings and scoring systems out there like those by Ken Pomeroy and Jeff Sagarin.
Using prior domain knowledge, along with these insights from research, I decided to take a similar approach to other models out there while making a few interesting changes. My high-level approach can be broken down into several steps:
- Collect high-performing rankings, scores, and ratings that aim to measure the quality of a given team
- Compile these metrics into one encompassing composite score that provides a reliable measure of ability
- Compute the difference in composite scores between teams for each possible matchup
- Train and test logistic regression on the composite score differences to predict future matchups
Model Breakdown
Following this approach, my model consists of two different parts. Each of these parts are uniquely weighted and used to generate each team’s composite score. Check out the visualization below for an overview of the various inputs:
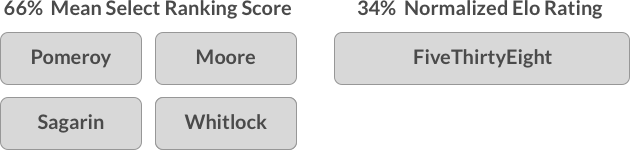
These weights were selected after testing several variations against each other. Over the rest of the article, I will go into each portion of the model in a bit more detail before ultimately simulating this years tournament results.
Mean Select Ranking Score
One of the resources that I found most useful was a dataset containing Massey composite rankings over time. Massey rankings serve as a destination for checking all the other ranking systems out there. I made the decision to select the highest performing systems available and average out the scores. After fitting and testing separate logistic regression models for each consistently updated system, I found the the highest performing metrics to be Sagarin (SAG), Pomeroy (POM), Moore (MOR), and Whitlock (WLK).
After compiling a mean score of these rankings, I fit and tested logistic regression on this feature alone and got a log loss of -0.543 which was an improvement over both my baseline seed-based model and an overall average ranking implementation.
Normalized Elo Rating
If you’ve ever looked at any of the methodology behind a FiveThirtyEight sports prediction, you’ve probably come across Elo once or twice. Nate Silver and the team there are huge advocates of Elo so after I came across Liam Kirwin’s implementation on Kaggle, I had to look into incorporating it into my model somehow.
If you aren’t familiar with the Elo rating system, it’s an iterative method for calculating the relative skill levels of players in zero-sum games. You may have heard of it being used for chess or other board/video games, but just know that the applications are endless. Elo is typically calculated using the formula below:
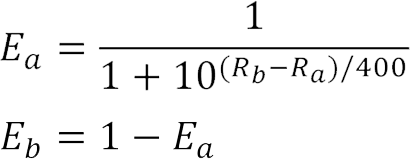
Calculating the Elo score for each team took some time since the program had to iterate through every game played and adjust the corresponding team’s rating. Once calculated, the Elo-based logistic regression model also performed quite well with a log loss of -0.543 to tie the previous result from the select ranking model.
Model Evaluation
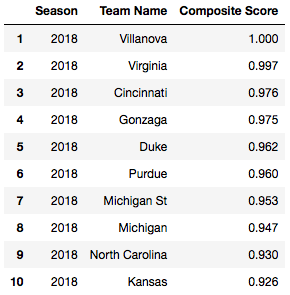
Once both of the prior scores were collected, they were rescaled to both fall between 0 and 1 . They were then weighted using the above methodology and subsequently compiled into the final composite score for each team which was ultimately used for our logistic regression model. The model scored a log loss of -0.540 on the training data using cross validation, which was a slight improvement over either portion on it’s own!
For a better idea of what the composite scores looked like, check out the top ten best teams in this year’s tournament according to the metric:
Tournament Simulation
All of this is good stuff, but what we really want to see is how all of these scores and probabilities apply to this year’s bracket! Thanks to Zach Mayer’s awesome R package titled kaggleNCAA, this was fairly easy to accomplish. After running my model with 1000 simulations, I got the following results:
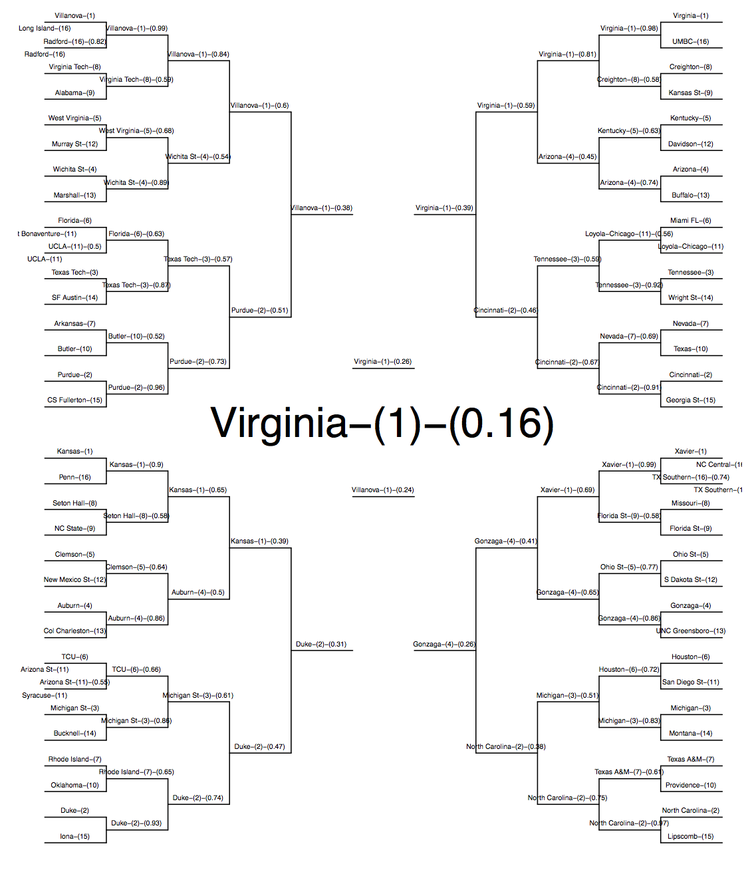
As you can see, in the long term, my model predicts the most likely winner to be Virginia with a 16% chance. Some interesting picks also include Duke (2) and Gonzaga (4) as favorites to reach the Final Four and likely first round upsets from both Florida St. (9) and Loyola-Chicago (11).
Wrapping Up
Congrats if you made it this far! Overall, I’m happy to say the undertaking of this project has made me a more competent data scientist. I’m also very excited to check out this year’s tournament and more than anything, I’m eager to tune and improve my model for next year! For the code and full Jupyter Notebook, see my Github.
Thanks for reading! If you enjoyed this post and you’re feeling generous, perhaps follow me on Twitter. You can also subscribe in the form below to get future posts like this one straight to your inbox. 🔥