Quantified Conor: Q1 2021
Mar 30, 2021 · 5 min · Quantified Self
This is my first quantified self report. Since last year, I've been tracking various metrics to learn more about myself and my well-being. I'm planning on publishing some version of this post at the end of each quarter and comparing results, though we'll see how that cadence feels down the line.
Some of these metrics are captured automatically using Zapier and Airtable while the others are logged manually each morning. Stay tuned for an upcoming post with more details on how you can set up something similar for yourself. This post is inspired by similar reports from Julian Lehr and Felix Krauss, which I highly recommend checking out.
😃 Happiness
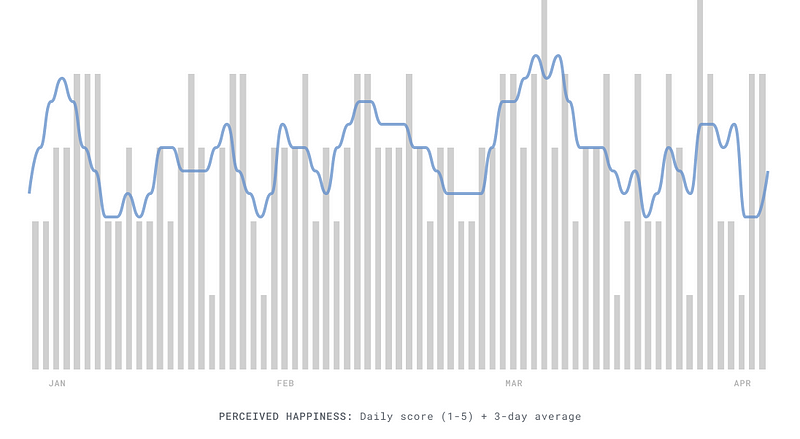
Each morning, I rate my perceived happiness 1-5 depending on how I'm feeling. Recently, I discovered that it's a better mental model to think about these scores as ranging from -2 to +2, but I suppose it all comes out the same.
My average happiness came out to 2.93 with a 0.976 daily standard deviation. As is the case with most of these metrics, I'll have more to talk about when I can compare to the previous quarter.
😴 Sleep
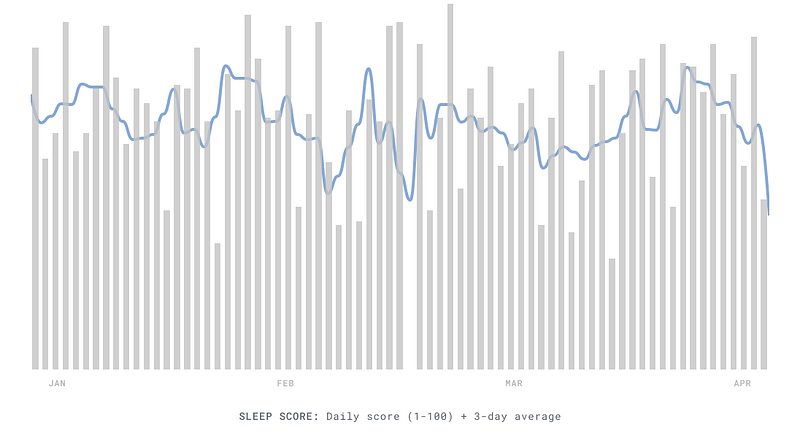
Sleep score is a less subjective metric since it's computed automatically with my Apple Watch + AutoSleep. As far as I can tell, it's a composite score of time asleep, movement, and heart rate, and seems to be pretty consistent with how I feel the next morning.
My average time asleep was 7:05 hours with 0:58 minutes of deep sleep. My average bed time was 12:19, wake up time was 7:56, and perceived sleep score was 3.01 (measured subjectively out of 5).
✅ Habits

I log habits for a few different things that I've realized are important to me and my happiness. You can see the daily completions above, and the averages below:
- Wake up on time: 51%
- Meditation: 74%
- Journal: 85%
- Training: 89%
- Writing: 44%
- Coffee: 67%
- Alcohol: 56%
Just glancing at these numbers, I would like to see waking up on time and writing end up much higher next time than they were this quarter. I did end up writing 7 blog posts somehow, though it certainly didn't feel like it to me.
It also couldn't hurt to lower that alcohol rate, which I'm sure is going to stress some people out reading this. As a meta note, I'm excited about how this this chart came out! It's cool to look back on the daily progress over the course of a few months.
👟 Fitness
It's worth taking a deeper dive into physical activity and training, which for me usually means weightlifting or running. I log everything here through my Apple Watch + Strava, which does a solid enough job.
I was really consistent this quarter. Maybe to the point where I should take a few more rest days, but my body seems to be holding up okay. I logged 70 workouts where 62 were lifting and only 8 were running. I would like that split to definitely even out more over the next quarter. My average workout duration was 57:13 hours with an average heart rate of 124 beats per minute.
🎒 Movement
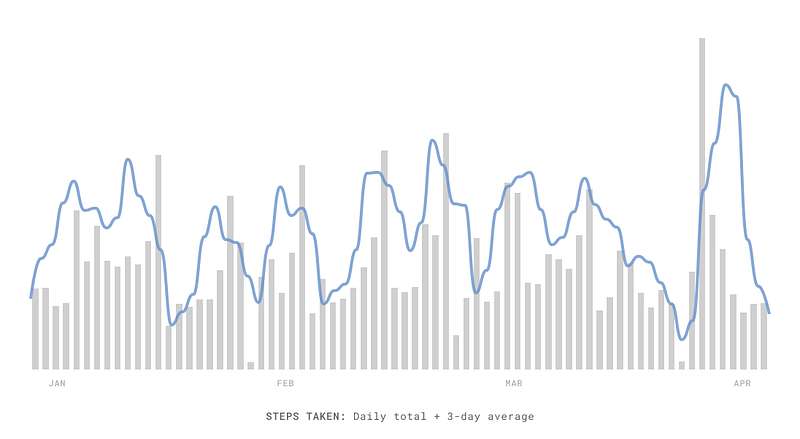
Steps is a tricky metric since running skews the data so much. You can see this above in the recent days, as weather has improved in New York and I started running more. I averaged 7,073 steps per day. I would be really surprised if this didn't improve this summer.
I also automatically log the places I go with Swarm. While I didn't travel outside of New York this quarter, there's still some interesting stuff here in terms of the types of places I frequented:
- Gyms: 54 check-ins
- Parks: 17 check-ins
- Coffee shops: 11 check-ins
- Grocery stores: 6 check-ins
- Pizza places: 4 check-ins
Coverage definitely isn't 100% here but turned out to be directionally, pretty good. Hopefully we see a little more diversity here in the next quarter.
💻 Screentime
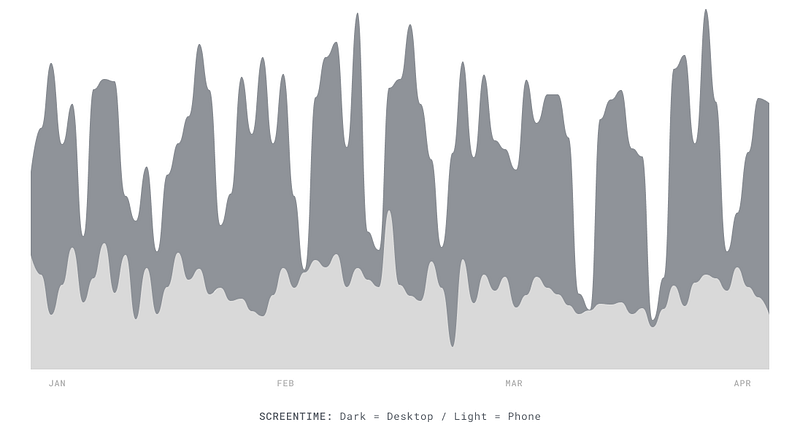
I track screen time for both my desktop and phone usage. Desktop is computed automatically using RescueTime while I'm still logging phone data manually each morning using Apple Screentime.
It's interesting to see above how consistent phone usage is in comparison to desktop. It's probably a good thing to get away from my computer every once in a while, so I'm okay with it staying kind-of spiky in the future.
My average phone time was 3:32 hours with 1:44 of which coming on social apps. On desktop (or my laptop), I spent an average of 6:04 hours with 3:43 of which labeled "productive" by RescueTime, though I need to revisit the labeling logic for this since things like Slack are still being labeled as unproductive at the moment.
📚 Reading
Last but not least, I thought it would be fun to look at my reading habits. To be perfectly honest, carving out time for reading was a struggle this quarter. I only finished 1 book on my Kindle (lowest in a long time), though I still saved 435 online articles. No way to sugarcoat it, that split is straight-up concerning to me. I'm going to try to be better there.
As far as my favorite things I read, the best system I currently have here is looking back at previous issues of my weekly newsletter, Oversimplified, and retroactively picking some out. So here are my personal favorite online reads from last 3 months or so, in chronological order:
- My Engineering Axioms
- 100 Tips for a Better Life
- Gardens: An Essay on the Human Condition
- The Michael Scott Theory of Social Class
- Frameworks
- My Product is My Garden
- Common Mistakes in Defining Metrics
- How to Eat an Elephant, One Atomic Concept at a Time
- The Modern Data Stack: Past, Present, and Future
- Building the Air Data Stack
- Special
Wrapping up
This report was a lot of fun to put together. I'm going to try and keep it lightweight so that it doesn't become a burden to reproduce every few months, but I'm optimistic. I hope you found something interesting in here, and stay tuned for more details on how I track all of this from a process and tech stack perspective. Until next time.
Thanks for reading! If you enjoyed this post and you’re feeling generous, you can perhaps follow me on Twitter. You can also subscribe in the form below to get future posts like this one straight to your inbox. 🔥