The Modern Startup Analytics Stack
Feb 27, 2021 · 8 min · Data Science
Analytics should inform every decision at a startup from strategy to tactics. Several years ago this might have been a hot take. It definitely isn't anymore. Analytics tooling and the discourse around these tools have heated up considerably and are becoming first-class citizens in the minds of startup founders.
I want to hit on a couple of things in this post. I'll first provide an overview of the analytics stack as it pertains to an early-stage startup. Then I'll dive into a case study of what our stack looks like at Hugo. Plenty of ideas in this post are inspired by prior art so I've linked to lots of great resources throughout.
Answering Business Questions
At the end of the day, the objective of any analytics stack is to answer questions about the business with data. In Carl Anderson's Creating a Data Driven Organization, he proposes that these questions show up in six forms:
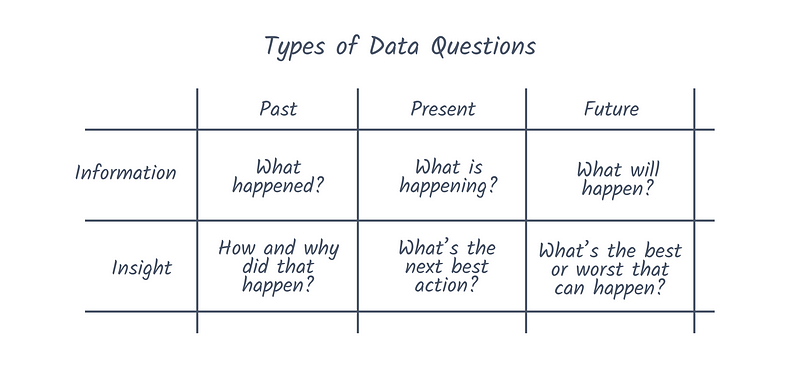
This is a simplified view of course. Not all data questions are as simple as pulling the number of signups from last month. It's inevitable that more vague and bespoke questions arise. These examples from Technically are just a few potential candidates:
- What behavior in a user’s first day indicates they’re likely to sign up for a paid plan?
- What’s our net dollar retention for customers with more than 50 employees?
- Which paid marketing channel has been most effective over the past 7 days?
One way to audit your analytics stack is to test it against some of these questions. If an investor or board member asked you one of these bullet points, could you confidently provide an answer given the current state of analytics?
It's important to remember that you aren't building out this stack just to "do analytics" but rather to unlock answers to important questions. The nice thing is that don't need all that much complexity to answer data questions at a startup. You can get 80% of the way there with just a few puzzle pieces.
The Analytics Stack
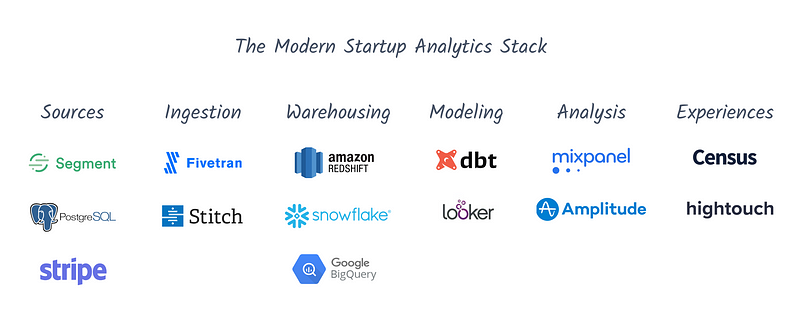
Different thought leaders have different ways of breaking down the analytics stack, but I like the level of abstraction below for the purposes of this post. Take it easy on me if I leave anything out. I promise the graphic below is not exhaustive. I'll touch on each of these components:
- Sources: Places where the data comes from
- Ingestion: Moving the data into your warehouse
- Warehousing: Where your data lives
- Modeling: Getting your data ready to use
- Analysis: Answering data questions
- Experiences: Syncing and using data in downstream tools
Sources
These are all the places where data comes from. If that sounds a bit broad and intimidating then that's because it is. Data is generated all over the place and in differing formats:
- Event instrumentation: Firing events every time a user takes some distinct action in the product. This is mostly done in code, though tools like Segment and Heap are increasingly popular for providing infrastructure to support sending and managing events.
- Production data stores: Backend databases like PostgreSQL or MongoDB often contain useful information about users, though analytics is not the primary use case of these systems.
- Downstream tools: If you abstract away parts of the user experience with other SaaS tools then chances are you'll want their data to answer questions. This could be Salesforce, Hubspot, Stripe, and lots more.
Ingestion
Once your data is generated, you need to get it into your data warehouse. The two most popular options here are Fivetran and Stitch. However, if you're using Segment for instrumentation then it makes a lot of sense to use it for transporting your data as well.
Warehousing
This is where your data lives, your source of truth. The three big players in the space are Snowflake, BigQuery, and Redshift. You can also build your own infrastructure with something like Hive and Presto but for the vast majority of startups, that's a can of worms you don't need to open. Pick the warehouse that makes sense for you and go from there.
Modeling
Here's where things start to get fun. You have data in your data warehouse of choice but it's not all that useful for end users. If your event instrumentation tool provides structured schemas for events, then that definitely helps, but how do you stitch together all of these sources to enable simple and repeatable answers to business questions? This is where dbt or "data build tool" comes in.
You can get set up with dbt with one seat for free and create jobs that run scheduled transformations on tables in your data warehouse. This is a breeze compared to other approaches that generally involve various SQL files and workflow orchestrators like Airflow. Once this step is done, you will have new tables in your data warehouse that are cleaned up, easy to work with, and updated on a recurring schedule.
Analysis
This is what most employees will know best and is hopefully the only step they will need to know to get value out of your analytics stack. Note that this section could have just as easily been called "data visualization" or "business intelligence" instead. Apples to apples.
There are far too many tools in this space to mention in one breath, but some of the ones that should be on your radar are: Looker, Amplitude, Mixpanel, Tableau, Chartio, Mode, and Google Sheets. However, there's a spectrum of features to be aware of within this list:
- Event tracking: Let's say you want to see how many users are clicking a new feature. You could write some SQL but ideally you don't need code for surface-level insights like this. You want to drag-and-drop your way to answers. Looker, Amplitude, and Mixpanel support this behavior while other tools take a different approach.
- Dashboarding: Not every question and answer has to be ad-hoc. You should have persistent visualizations that display key metrics and indicators of trends. This is probably what comes to mind when you think of data visualization, and fits nicely in the use case for Chartio (rest in peace), Tableau, and even Google Sheets. Though Looker and Amplitude offer this functionality as well.
- Notebooks: Data science "notebooks" have taken off in recent years as the atomic unit for analyses. I think this is the least essential feature for a startup and is still being figured out from a product perspective, though the leader here Mode has solid reviews. If you have someone who has experience in Python, then Jupyter notebooks are a great lightweight option when more complex analysis does arise.
Experiences
While it might come after the true "analytics" ends, I think this is an important concept to mention in today's data stack. This step is also known as "data operationalization" but quite frankly we need a better name. Maybe this is it, maybe it's not.
In short, data experiences are the usage of marketing and product data in downstream tools. Players like Census and Hightouch have focused on this part of the value chain to great effect. Some of the big use cases I see are:
- Syncing product engagement data into your CRM
- Sending personalized data-driven emails
- Ensuring one instrumented definition for key metrics in tools
Case Study: Hugo
One thing that I find helpful for posts like this is case studies. It's all well and good to lay out parts of the stack but things always seem a little fuzzier when you get to the actual implementation.
If you aren't familiar with Hugo, we're a B2B SaaS tool for better meetings through centralized, actionable notes. Here's what our stack looks like today at ~12 employees with a fairly data-focused culture:
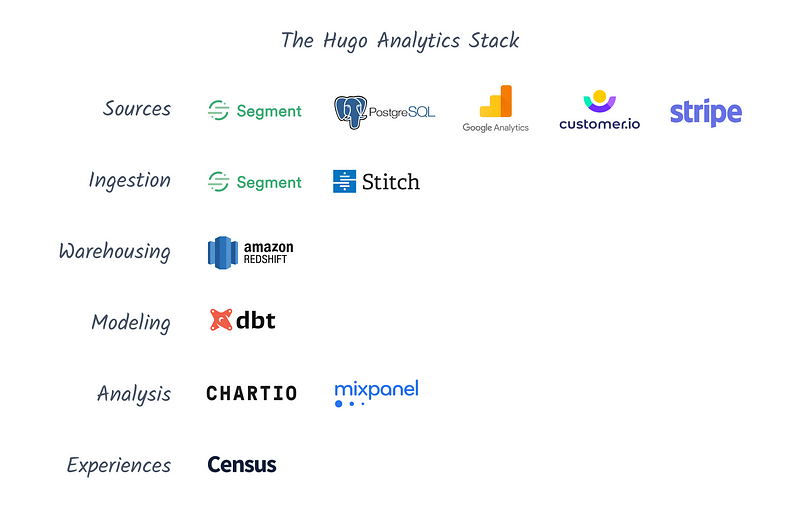
Sources: Segment, Postgres, Google Analytics, Stripe, Customer.io
We lean on Segment quite heavily at Hugo. I've heard from others that once you hit scale, Segment can become a burden with costs and limitations. While we have started to see some of that already, overall it's been a really effective tool for creating massive leverage with just a handful of active employees.
Things like page views are tracked automatically with Segment and explicit track events are implemented with code in the app. We also have production data that gets synced from Postgres, some top of funnel information that is pulled from Google Analytics, revenue and subscription related data from Stripe, and transactional email data from Customer.io to name a few.
Ingestion: Segment, Stitch
All of these disparate data sources described above get piped into our data warehouse using Segment and Stitch. Segment covers most of our bases here for analytics purposes, while Stitch is tasked with a scheduled job for syncing production data to the warehouse.
Warehousing: Redshift
We choose Redshift as our data warehouse rather than BigQuery or Snowflake. It does lack some of the bells and whistles of BigQuery and Snowflake, but the lower costs and ease of already being in the Amazon ecosystem made sense at this stage. We'll see how this progresses over time.
Modeling: dbt
To be honest, I'm not sure if there really is another viable option aside from dbt and LookML for startups that want to easily transform their data.
We implemented dbt for one seat and scheduled daily jobs using dbt Cloud and it's been great. The tool is super lightweight to get started and it seems like one person that knows SQL can oversee this function for good period of time, which is a huge plus at our stage.
Analysis: Chartio, Mixpanel, Jupyter notebooks
We handle our data analysis with two tools: Chartio and Mixpanel. Most of the heavy lifting takes place in Chartio (rest in peace, again) where we have dashboards and sandboxes set up for ad-hoc moments when we need to query and visualize results.
Mixpanel gets used less often and is often more of a first-pass for non-critical questions. Things like "How many people clicked this button?" can be done 10x faster in Mixpanel than other options, but you can't go much further beyond that with confidence, at least in my experience. Lastly, I would be remiss if I didn't mention Jupyter notebooks for more complex analysis, but that has only been necessary periodically at our stage.
Experiences: Census
We have used Segment Personas for this in the past but are in the process of switching to Census, so I'll report back with how it's going further down the line. We already do a good bit of operationalizing data at Hugo so this should be a nice tailwind.
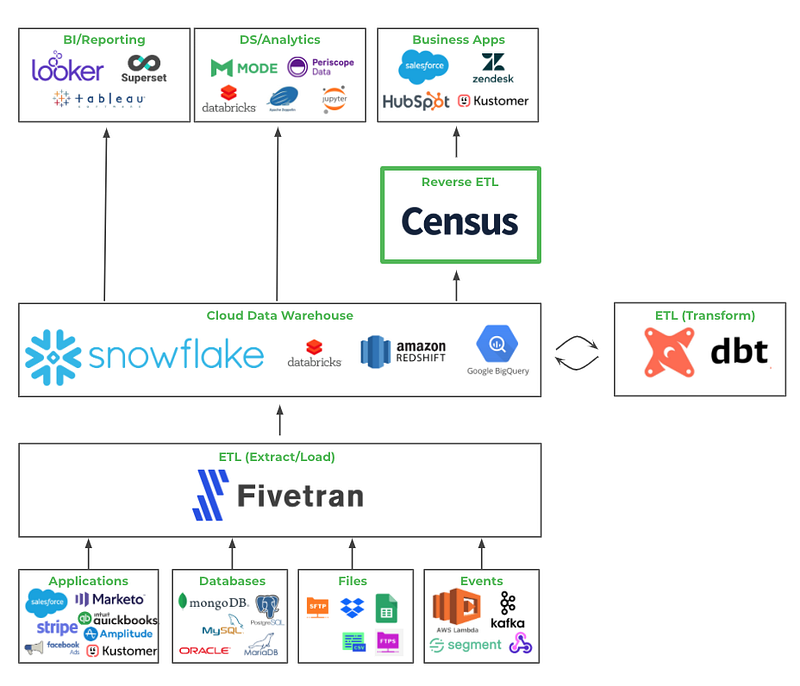
The two use cases that come up most often for us are syncing product data to Vitally for CS purposes and sending data-driven emails. For what it's worth, it's also quite nice to have Redshift as our source of truth and not have to maintain different metric definitions in all of our downstream tools: Chartio, Mixpanel, Customer.io, and Vitally. Put it all together, and you get something like this Sequoia visualization below:
Resources
I referenced lots of other great material before and in the process of writing this post. Before I leave you, here are the links that I think are well worth your time:
Overviews
- What Your Data Team Is Using: The Analytics Stack
- The Startup Founder's Guide to Analytics
- Emerging Architectures for Modern Data Infrastructure
- The 3 Things to Keep in Mind While Building the Modern Data Stack
Case studies
- Why Most Analytics Efforts Fail
- Building the Air Data Stack
- Building Analytics at 500px
- Priorities of a One-Person Analytics Team at Lola.com
Thanks for reading! If you enjoyed this post and you’re feeling generous, you can perhaps follow me on Twitter. You can also subscribe in the form below to get future posts like this one straight to your inbox. 🔥