5 Lessons from a Data Science Intern at a Tech Unicorn
Aug 6, 2018 · 6 min · Data Science
As we move into August and summer begins to wind down, I thought I’d take the time to reflect on my last 12 weeks as a Data Science Intern for Unity Technologies in San Francisco, CA.
First, let’s go over a little background. I’m currently an undergraduate student entering my last year at school while studying data science. How did I end up at Unity? I applied online, went through the interview process, and eventually accepted the offer to come out to HQ for the summer as one of 30 summer interns across various locations in North America.
My goal is to share a handful of actionable lessons, takeaways, thoughts, and advice from the memorable experience.

What is Unity?
In order to describe Unity does, I’ll defer to the company website:
“Unity is the creator of the world’s most widely used real-time 3D (RT3D) development platform, giving developers around the world the tools to create rich, interactive 2D, 3D, VR and AR experiences. Our 800+ person engineering team keeps Unity at the bleeding-edge of technology by working alongside partners such as Facebook, Google, Magic Leap, Microsoft, and Oculus to ensure optimized support for the latest releases and platforms.
Experiences made with Unity reach nearly 3 billion devices worldwide, and were installed 24 billion times in the last 12 months. Unity is powering RT3D in architecture, automotive, construction, engineering, film, games, and more”
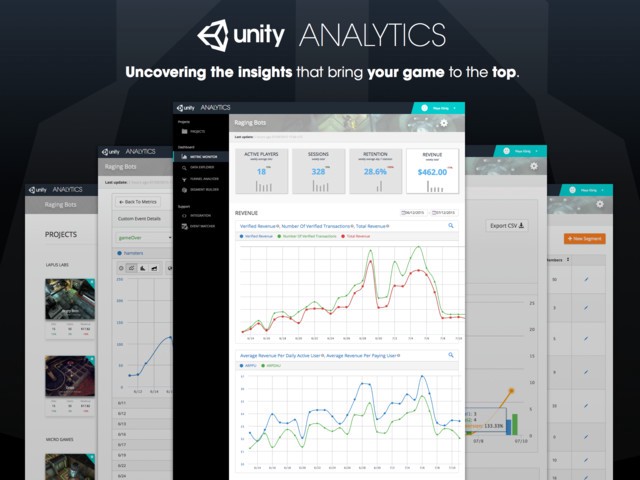
Unity Analytics
More specifically, I spent my summer working within the awesome team at Unity Analytics. Analytics is a feature within the suite of gaming solutions, focused on helping developers to deliver dynamic experiences fueled by data insight and personalization.
Furthermore, I was a proud member of the Data Science Team where the mission is to democratize data, extract and enable insights for customers, and build tools to increase engagement.
Now that you know a little more about the team and my role, let’s dive into a handful of the main insights that I’ll take away from the internship.
The Importance of Empathy
It’s been a popular hot take over the last few years to say that empathy is the most important skill for Data Scientists. I don’t know if this is true or not, but I can say that when it comes to skills like data analysis, communicating results, and product intuition, empathy plays a key role. Even for something as simple as documentation, the ability to put yourself in the shoes of someone else can be an extremely powerful tool.
This is true for most roles out there, but I’ve found that it’s especially applicable for Data Scientists. Simply put, we work with data to provide value.When working with data on a daily basis, it’s easy to forget that data isn’t just floats, strings, bits, or bytes — but rather it’s a representation of the user’s voice at scale. Without empathy, we lose the bigger picture and fail to produce meaningful, impactful work.
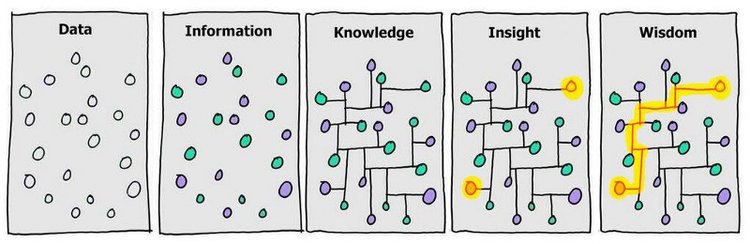
Information Isn’t Enough
As Data Scientists, performing analysis and providing insights can often be a big part of what we do. Notice that I said ‘insights’ rather than ‘information’. This may seem trivial, but there is a subtle, yet important difference between the two words that underlies a fundamental mistake inexperienced Data Scientists (including myself) make quite often.
Information is a collection of data points used to understand something, whereas insights use this information to drive action.
I thought about this distinction a lot over the summer. Early on, I found myself presenting analysis and often receiving questions similar to “So, what’s the takeaway here?” which is essentially a more polite way of saying “What am I supposed to do with this?”. Upon reflection, I know now that my mistake was providing information, not insights.
It’s one thing to provide interesting analysis, but it’s a whole other thing to drive action. When you are finishing up your analysis, always ask yourself the following questions:
- What are the main takeaways here?
- What action should key stakeholders take?
Spend time thinking of these points sooner rather than later and once you have, address them directly when communicating results. By doing this, you not only deliver a clearer message, but also increase the probability of your work making a significant impact.
A Beginner’s Mindset
Arguably my favorite part of my experience was the opportunity to work with a ton of super impressive people, way more knowledgable than myself. You’ve probably heard of the popular quote from Jim Rohn, “You’re the average of the 5 people you spend the most time with”.
This isn’t just applicable when it comes to small circles of friends, but it can also be applied at scale. If you surround yourself with smart people, you’ll probably be driven to become smarter yourself. Makes sense.
But it’s not always this straightforward. This fails to mention some obstacles that get in the way of this effect. Most notably, we are all hard-wired to be somewhat egotistical and overconfident. We enjoy being right and we like to be validated, whether socially or intellectually or both.
Looking back, I would say that I came into this summer a bit overconfident. It took all of one week for me to realize that in order to get the most of this experience, I had to shift my mindset. I had to be willing to seek out help, admit when I was wrong, and ask the ‘dumb question’ sometimes.
It’s comfortable to feel like the smartest person in the room. Comfortability is nice, but it often serves as the enemy of growth. In order to see the benefits that Jim Rohn was talking about, you must be willing to adopt a beginner’s mindset and be humbled constantly, both personally and in your career.
Trustworthy Data Analysis
This concept from an excellent article by Roger Peng regarding trustworthy data analysis was one that I kept coming back to throughout the summer. The post touches on an interesting way to segment and think about the analytical process, referred to as the ABC’s of data analysis.
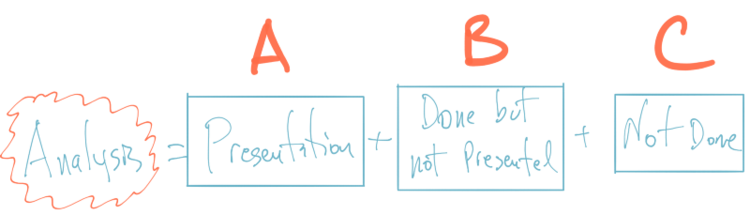
In the image above, A represents the analysis that you present to stakeholders, B is the analysis that you did but didn’t include in the write-up, and C is the stuff that you either forgot about or didn’t have time to check out. Generally speaking, you want to optimize A for clarity while bolstering B for evidence and minimizing C as much as possible in the given time frame.
By keeping this framework in mind, you can more effectively prepare for possible questions about your analysis beforehand. This leads to more convincing results and less responses along the lines of “I’ll look into it.”
Ruthlessly Challenge Assumptions
There’s plenty of challenges that you face in industry that don’t necessarily ever come up at university. In school, you are typically given a structured problem and you provide a (hopefully correct) answer. In industry, this isn’t the case. The problems will often be unstructured, vague, and complex.
You can’t assume nearly as much in these situations. Assumptions cause wrong turns which lead to backtracking and pivots — both of which generally result in missed deadlines or inferior work.
It may take more time early on, but it’s always well-worth the effort spent to fully flesh out a problem before diving in. This can may mean any number of things including: white-boarding, researching, brainstorming, or planning. Do whatever works best for you, whether it takes a few minutes or several hours.
Go through the process of challenging even the most obvious assumptions.Reach out and talk to others. Collaborate and get lots of feedback on ideas. Trust but verify. Don’t accept something simply because “that’s the way it’s always done” and most importantly, don’t be afraid to push back a little bit.When things come to a close, your stakeholders will be glad you did.
Wrapping Up
Last fall, I sat down and grabbed a pen and notepad. I wrote down everything that I wanted to accomplish in the upcoming year. Number one on that list was to fly out to the west coast and become a more effective Data Scientist among some of the smartest minds in tech.
It certainly wasn’t easy. I failed constantly and sacrificed plenty to get here, but I couldn’t be more grateful for the opportunity spend the last few months using data science to create value for an incredible product in an emerging industry.
I accomplished a lot, made plenty of mistakes, and most importantly, learned more than I could’ve ever anticipated thanks to an awesome team, manager, and group of mentors. I hope that I was successful in communicating at least a few of those lessons to you. Until next time.
Thanks for reading! If you enjoyed this post and you’re feeling generous, perhaps follow me on Twitter. You can also subscribe in the form below to get future posts like this one straight to your inbox. 🔥